Displaying OpenStreetMap tags via Leaflet.js
November 7th, 2019
Earlier this week, I was riding my electric scooter down the rough entry road to UCSC and thought “I wonder if there’s any way to get data on where the roads are smoother”.
Just one single way was tagged with smoothness in all of Santa Cruz.
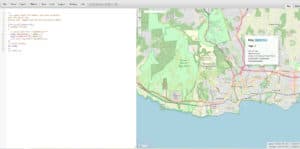
A little research lead me to the smoothness=* tag in OpenStreetMap. Following a link to Overpass Turbo lead to a template query I could run to see where these tags were implemented, but the result was not promising. In all of the general Santa Cruz area, only one single way had a smoothness tag.
I immediately set to fix this and began placing smoothness=* tags wherever I knew the conditions of the road.
After inputting some 460+ ways and 15 polygons with smoothness data, I was ready to display it.
I already knew I wanted to use Leaflet.js, but having no experience with it meant I had no clue where to start.
After following the basic tutorials in order to get a basic moveable map using OpenStreetMap tiles up and running I began searching for ways to link the data I was seeing in Overpass Turbo with Leaflet.
The new and improved map after several days of tagging and manually visiting the different roads and paths.
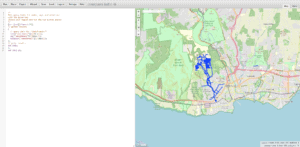
As it turns out, Leaflet and Overpass can communicate using the GeoJSON standard. Pressing ‘export’ in the upper right corner of Overpass Turbo exported a .geojson file that I could then load into leaflet with the lines:
var geojsonLayer = new L.GeoJSON.AJAX("test.geojson");
geojsonLayer.addTo(map);
This leads to the map displaying all points, polygons, and ways matching your Overpass query in blue.
That’s cool and all, but I was envisioning something a little more visually attractive – something that would give you all the information at a glance.
A few more lines to the geojsonLayer initialization and some color assistance from my non-color-blind roommates lead to this:
var geojsonLayer = new L.GeoJSON.AJAX("test.geojson",
{
    style: function(feature) {
        switch (feature.properties.smoothness) {
            case 'excellent': return {color: "#136e13"};
            case 'good': return {color: "#00ff00"};
            case 'intermediate': return {color: "#ffcc00"};
            case 'bad': return {color: "#ff7700"};
            case 'very_bad': return {color: "#ff0000"};
            case 'horrible': return {color: "#aa0000"};
            case 'impassable': return {color: "#000000"};
        }
    }
}
));
geojsonLayer.addTo(map);
The final result can be viewed live here: https://joeybabcock.me/tests/php/leaflet/
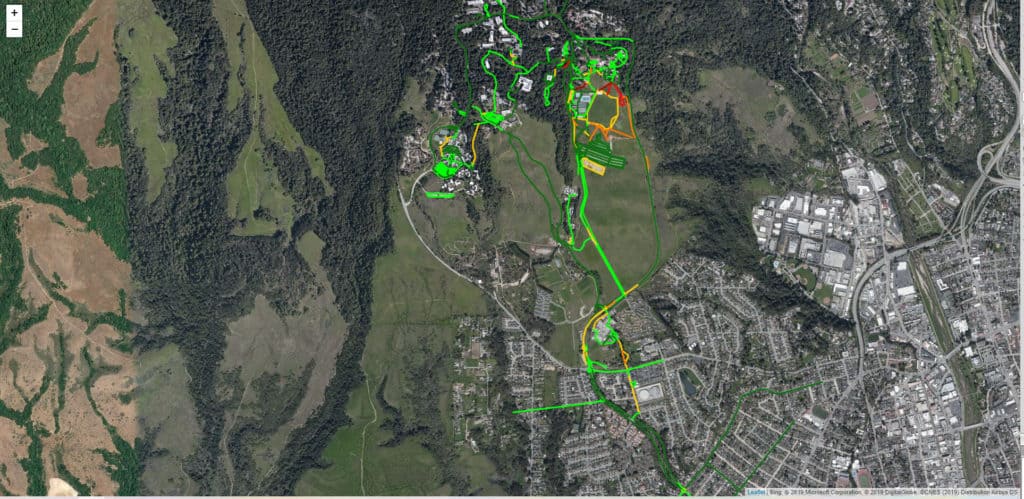
7 different colors representing the 7 states found around the greater UCSC area.
Comments